
Monday 8 October 2012


Saturday 6 October 2012

Tuesday 2 October 2012

Monday 1 October 2012
Example 5, Page 9

Example 7
S(square) is a subset of Q(rectangle).
This is true. A rectangle is defined as having four sides while a square is defined as having four equal sides (both with sides intersecting at 90 degrees). Since the square fulfills a rectangle's criteria but a rectangle does not fulfill a square's criteria, we can say S(square) is a subset of Q(rectangle).
R(rhombuses) is a subset of P(parallelograms).
This is true. A parallelogram is defined as having four sides with opposite sides being parallel while a rhombus is described as having four equal sides with opposite sides being parallel. Since a rhombus fulfills a parallelogram's criteria while a parallelogram fulfills a rhombi's criteria, we can say R(rhombuses) is a subset of P(parallelograms).
T(trapeziums) is not a subset of S, Q, R, P.
A trapezium is a quadrilateral with no sides parallel. Since the rest of the sets are quadrilaterals with parallel lines, we can say T(trapeziums) is not a subset of S, Q, R, P.
Q is a subset of P.
This is true. A parallelogram is a 4-sided shape where opposites sides are parallel. Rectangle fulfills the criteria, hence it is a subset of P. A rectangle's corners must be 90 degrees, and since a parallelogram does not fulfill that criteria, it cannot be a subset of Q.
Therefore, Wai Kit's venn diagram is not right and Mr. Johari's diagram is correct!
However, a square is a rhombus but a rhombus is not a rectangle. So how do we draw a venn diagram in this case? (Mr. Johari please help!)
Done by Carissa Liew
This is true. A rectangle is defined as having four sides while a square is defined as having four equal sides (both with sides intersecting at 90 degrees). Since the square fulfills a rectangle's criteria but a rectangle does not fulfill a square's criteria, we can say S(square) is a subset of Q(rectangle).
R(rhombuses) is a subset of P(parallelograms).
This is true. A parallelogram is defined as having four sides with opposite sides being parallel while a rhombus is described as having four equal sides with opposite sides being parallel. Since a rhombus fulfills a parallelogram's criteria while a parallelogram fulfills a rhombi's criteria, we can say R(rhombuses) is a subset of P(parallelograms).
T(trapeziums) is not a subset of S, Q, R, P.
A trapezium is a quadrilateral with no sides parallel. Since the rest of the sets are quadrilaterals with parallel lines, we can say T(trapeziums) is not a subset of S, Q, R, P.
Q is a subset of P.
This is true. A parallelogram is a 4-sided shape where opposites sides are parallel. Rectangle fulfills the criteria, hence it is a subset of P. A rectangle's corners must be 90 degrees, and since a parallelogram does not fulfill that criteria, it cannot be a subset of Q.
Therefore, Wai Kit's venn diagram is not right and Mr. Johari's diagram is correct!
")
However, a square is a rhombus but a rhombus is not a rectangle. So how do we draw a venn diagram in this case? (Mr. Johari please help!)
Done by Carissa Liew
Friday 28 September 2012


Tuesday 25 September 2012
EOY Information
Here are some information about the paper:
Duration: 2 hr 30 min
Total marks: 100
40% of paper on Term 1 and 2 topics:
60% of paper on Term 3 and 4 topics:
Duration: 2 hr 30 min
Total marks: 100
40% of paper on Term 1 and 2 topics:
- Algebra and algebraic fractions
- Linear graphs
- Quadratic equations and graphs
- Area, perimeter, volume and surface area
- Pythagoras' Theorem
- Indices
60% of paper on Term 3 and 4 topics:
- Standard form
- Congruence and Similarity
- Area and volume of similar figures and solids
- Basic trigonometry
- Matrices
- Probability
- Simultaneous equations and graphs
- Set notation and venn diagrams
- Direct and inverse proportion


Monday 24 September 2012
Set Theory - Task - A Visual Presentation and Recommendation
Mini Non-graded Performance Task : A Visual Presentation and Recommendation
You are the registrar of School of Science and Technology, Singapore (SST).
Since you have limited classrooms for classes, the school principal asked you to conduct a survey about the Applied Subjects you must offer for students.


Survey Results
After conducting a survey on 100 students, you obtained the following data:
40 students plan to enroll in Media Studies (M),
27 students prefer Fundamental of Electronic (F), and
23 students want to take Biotechnology (B).
Meanwhile 8 students prefer Media Studies (M) and Fundamental of Electronic (F),
10 students prefer Biotechnology (B) and Fundamental of Electronic (F), and
6 students prefer Biotechnology (B) and Media Studies (M), respectively.
Then you also found out that 5 students would like to enroll in all the three subjects, while 10 students prefer other subjects.
The principal required you to make a visual presentation of the data and a recommendation about the subjects to be offered.
Your presentation will be judged by the principal and the different department heads. Thus, make sure that it is clear, organized, accurate, and complete.
Venn diagram from oes_217
Wednesday 19 September 2012


Tuesday 18 September 2012


Monday 17 September 2012
Group 4 Example 15

3^3=27 (Total Possible Outcomes)
Number of 9s in Total Possible Outcomes: 7
Probability of score being 9: 7/27

Probability Group Activity - Group 3
Mini Task 4:
(a) Flipping a coin and getting heads, then flipping it again and getting tails
Ans: Independent. Flipping heads the first time does not mean that the coin will be more/less likely to land tails the second time. The chances are still 1/2.
(b) Rolling doubles with two dice, then rolling doubles again.
Ans: Independant. Rolling doubles the first time does not make it more/less likely that a double will be rolled a second time. The dice cannot "remember" its previous result and change the next result.
(c) Drawing (and removing) two aces from a normal deck cards, then drawing kings.
Ans: Dependant. After removing the 2 aces, there are less cards in the deck, so the deck "remembers" that 2 aces are already picked, so it is more likely that a king will be picked.
(d) Drawing (and removing) a red ball initially containing two red balls and three white balls, then drawing a white ball.
Ans: Dependent. After removing the first red ball, there are less balls in the bag, so there is a higher chance of picking a white ball.
Mini Task 5:
(a) 13/100 x 8/100 = 13/1250
(b) 1/6 x 1/6 = 1/36
(c) 1/52 x 1/52 = 1/2704
(d) 1/100 x 1/100 = 1/10000
Example 13
P(Getting heads 3 times in 3 tosses)
= 1/2 x 1/2 x 1/2
= 1/8
Links:
Maths groupwork 2

GROUP 1
Combined events are two or more events occurring at the same time or one after the other.
One example is:
There are 6 possible die outcomes each having a further 2 coin outcomes, giving a combined outcome of 12 possibilities. Therefore the probability of throwing a six and 'heads' is one outcome in twelve: . If the problem was changed
to the possibility of throwing an odd number and 'tails', the
table will show that this may occur 3 times, (1 tails, 3 tails,
5 tails) out of twelve outcomes, and therefore the probability
is reduces to 3
. If the problem was changed
to the possibility of throwing an odd number and 'tails', the
table will show that this may occur 3 times, (1 tails, 3 tails,
5 tails) out of twelve outcomes, and therefore the probability
is reduces to 3 12, or
  .
.
Another example is:
In a drawer, there are some white socks and some black socks. Tim takes out one sock and then a second. Draw a tree diagram to show the possible outcomes.
Example 10 Solution:


One example is:
| Heads 1 | Heads 2 | Heads 3 | Heads 4 | Heads 5 | Heads 6 |
| Tails 1 | Tails 2 | Tails 3 | Tails 4 | Tails 5 | Tails 6 |
There are 6 possible die outcomes each having a further 2 coin outcomes, giving a combined outcome of 12 possibilities. Therefore the probability of throwing a six and 'heads' is one outcome in twelve:
Another example is:
In a drawer, there are some white socks and some black socks. Tim takes out one sock and then a second. Draw a tree diagram to show the possible outcomes.
Example 10 Solution:


Probability Group activity
Discussion time: 20 minutes
Presentation of findings: 10 minutes
Comments: 10 minutes

Presentation of findings: 10 minutes
Comments: 10 minutes

Wednesday 5 September 2012


Construction
Definition

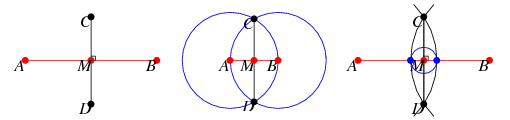
A perpendicular bisector
A. Constructing Perpendicular Bisector
B Angles Bisector
Perpendicular Bisector
A perpendicular bisector  of a line segment
  is a line segment perpendicular to
  and passing through the midpoint
  of
of  (left figure). The perpendicular bisector of a line segment can be constructed using a compass by drawing circles centered at
  and
and  with radius
  and connecting their two intersections. This line segment crosses
  at the midpoint
  of
of  (middle figure). If the midpoint
  is known, then the perpendicular bisector can be constructed by drawing a small auxiliary circle around
  , then drawing an arc from each endpoint that crosses the line
  at the farthest intersection of the circle with the line (i.e., arcs with radii
  and
and  respectively). Connecting the intersections of the arcs then gives the perpendicular bisector
  (right figure). Note that if the classical construction requirement that compasses be collapsible is dropped, then the auxiliary circle can be omitted and the rigid compass can be used to immediately draw the two arcs using any radius larger that half the length of
  .Angle Bisector
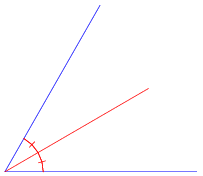
The (interior) bisector of an angle, also called the internal angle bisector (Kimberling 1998, pp. 11-12), is the line or line segment that divides the angle into two equal parts.
A. Constructing Perpendicular Bisector
B Angles Bisector
Subscribe to:
Posts (Atom)